Manpower Management
Labor Index
Employee Structure and Distribution
As of December 31st, 2024, the total number of employees in the VSO Group was 1,066. Male employees accounted for 27.5%, while female employees accounted for 72.5%. Employees in mainland China and other overseas regions represented 91.5% of the total workforce.
Composition of Group Employees by Country/Region
| Taiwan | China | Vietnam | Group Total | |
|---|---|---|---|---|
| Male | 4.2% | 16.7% | 6.6% | 27.5% |
| Female | 4.3% | 51.3% | 16.9% | 72.5% |
| Total | 8.5% | 68.0% | 23.5% | 100.0% |
- Taiwan
- China
- Vietnam
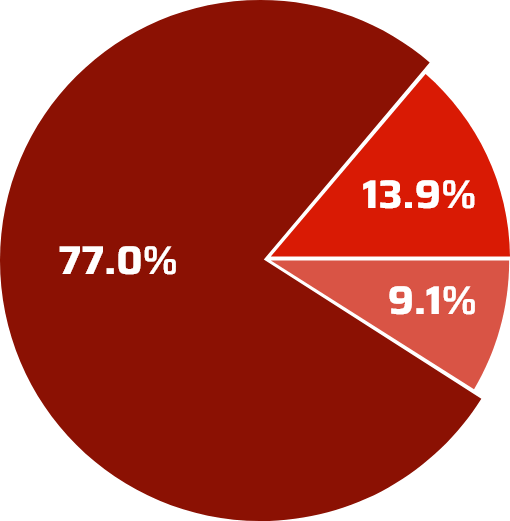
Educational Background Ratio by Group Locations
| TPE | JA | DG | SZ | Vietnam | Linkupon | ZJG | Group Total | |
|---|---|---|---|---|---|---|---|---|
| Master's degree and above |
1.6% | 0.3% | 0.0% | 0.0% | 0.2% | 0.2% | 0.0% | 2.3% |
| Bachelor degree | 4.5% | 1.3% | 1.1% | 2.9% | 2.1% | 0.5% | 0.3% | 12.7% |
| Others | 1.4% | 52.9% | 3.7% | 4.8% | 21.2% | 0.2% | 0.8% | 85.0% |
| Subtotal | 7.5% | 54.5% | 4.8% | 7.7% | 23.5% | 0.9% | 1.1% | 100.0% |
Age Ratio by Group Locations
| Gender & Age \ Locations |
TPE | JA | DG | SZ | Vietnam | Linkupon | ZJG | Group Total | |
|---|---|---|---|---|---|---|---|---|---|
| Male | ≦30 | 0.7% | 1.3% | 0.0% | 0.4% | 3.5% | 0.0% | 0.0% | 5.9% |
| 31-40 | 0.7% | 4.4% | 0.6% | 0.2% | 1.9% | 0.0% | 0.0% | 7.8% | |
| 41-50 | 1.2% | 3.9% | 1.3% | 1.3% | 0.9% | 0.2% | 0.2% | 9.0% | |
| ≧50 | 1.3% | 1.9% | 0.7% | 0.3% | 0.2% | 0.2% | 0.1% | 4.7% | |
| Total | 3.9% | 11.5% | 2.6% | 2.2% | 6.5% | 0.4% | 0.3% | 27.4% | |
| Female | ≦30 | 0.8% | 1.0% | 0.0% | 0.5% | 5.4% | 0.0% | 0.0% | 7.7% |
| 31-40 | 1.0% | 20.7% | 0.9% | 2.9% | 6.8% | 0.3% | 0.2% | 32.8% | |
| 41-50 | 1.0% | 18.8% | 1.1% | 1.5% | 4.6% | 0.1% | 0.6% | 27.7% | |
| ≧50 | 0.9% | 2.7% | 0.2% | 0.4% | 0.1% | 0.1% | 0.0% | 4.4% | |
| Total | 3.7% | 43.2% | 2.2% | 5.3% | 16.9% | 0.5% | 0.8% | 72.6% | |
Gender and Employee Rank Distribution by Group Locations
| Taiwan | China | Vietnam | |||||
|---|---|---|---|---|---|---|---|
| High-level Executive | Male | 8 | 0.8% | 7 | 0.7% | 6 | 0.6% |
| Female | 4 | 0.4% | 0 | 0.0% | 0 | 0.0% | |
| Total | 12 | 1.2% | 7 | 0.7% | 6 | 0.6% | |
| Mid-level Executive | Male | 6 | 0.6% | 4 | 0.4% | 6 | 0.6% |
| Female | 2 | 0.2% | 1 | 0.1% | 0 | 0.0% | |
| Total | 8 | 0.8% | 5 | 0.5% | 6 | 0.6% | |
| Indirect Labor | Male | 31 | 2.9% | 89 | 8.3% | 5 | 0.4% |
| Female | 40 | 3.8% | 164 | 15.4% | 26 | 2.4% | |
| Total | 71 | 6.7% | 253 | 23.7% | 31 | 2.8% | |
| Direct Labor | Male | 0 | 0.0% | 78 | 7.3% | 53 | 4.9% |
| Female | 0 | 0.0% | 382 | 35.8% | 154 | 14.4% | |
| Total | 0.0 | 0.0% | 460 | 43.1% | 207 | 19.3% | |